Area Chart
Create an area chart with dash::AreaChart, set its X-axis and Y-axis data and push updates to the dashboard in ESP-DASH Pro v5.
ESP-DASH Pro feature. This functionality is available only in the commercial edition of ESP-DASH.An area chart is a line chart with the region below the line filled, which emphasizes magnitude and cumulative totals over time or across categories. In ESP-DASH v5, area charts are created with the dash::AreaChart<X, Y> class template, where X and Y define the data types of the two axes.
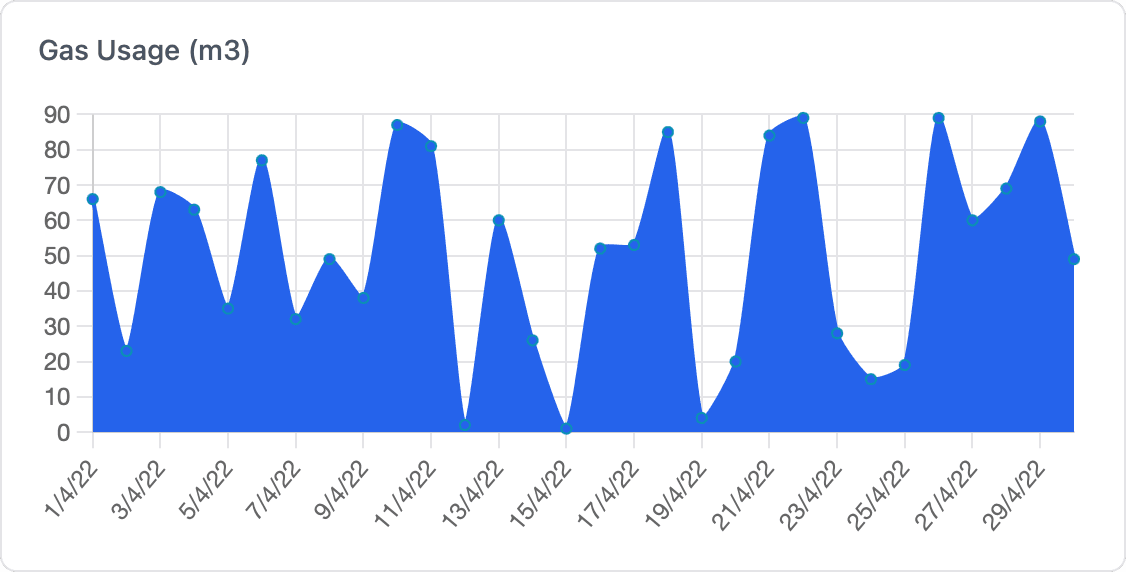
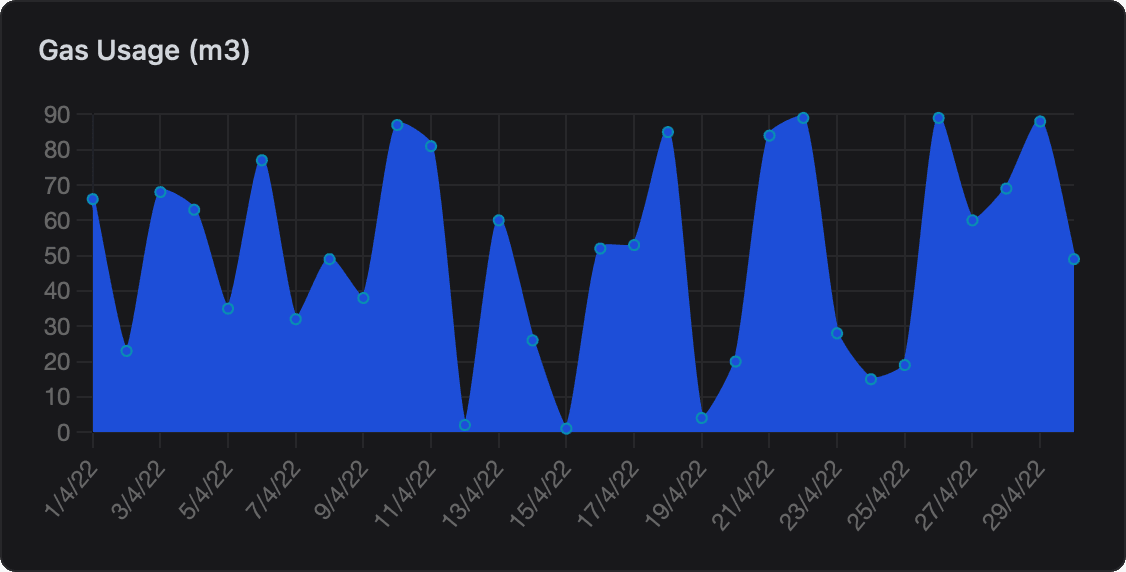
All v5 chart types share the same constructor signatures and methods. This page documents them for dash::AreaChart; see Bar Chart for the common reference.
Constructor
dash::AreaChart<X, Y> chart(ESPDash& dashboard, const char* name);
dash::AreaChart<X, Y> chart(const char* name);
The first form creates the chart and adds it to dashboard. The second form creates the chart without adding it to a dashboard; add it later with dashboard.add(chart).
Template parameters
Prop
Type
dash::string is an alias for Arduino String, or for std::string when DASH_USE_STL_STRING is defined. Any other type for X or Y fails to compile.
Constructor parameters
Prop
Type
// Category labels on the X-axis, integer values on the Y-axis
dash::AreaChart<const char*, int> rainfall(dashboard, "Cumulative Rainfall");

// Numeric X-axis, floating-point Y-axis
dash::AreaChart<int, float> growth(dashboard, "Growth");
Methods
setX
bool setX(X arr_x[], size_t x_size);Sets the X-axis data. The element type of arr_x must match the template parameter X. The chart stores a pointer to the array and marks the X-axis as changed; the data is sent on the next call to dashboard.sendUpdates(). Always returns true.
Prop
Type
const char* months[] = {"Jan", "Feb", "Mar", "Apr"};
rainfall.setX(months, 4);
setY
bool setY(Y arr_y[], size_t y_size);Sets the Y-axis data. The element type of arr_y must match the template parameter Y. The chart stores a pointer to the array and marks the Y-axis as changed; the data is sent on the next call to dashboard.sendUpdates(). Always returns true.
Prop
Type
int totals[] = {10, 25, 40, 60};
rainfall.setY(totals, 4);
Call setY() after changing the data
Modifying the array in place does not mark the chart as changed. After you update the values, call setY() (or setX()) again, then dashboard.sendUpdates(). Otherwise the change reaches clients only on the next full layout refresh, such as a page reload.
x and y
const X* x() const;
const Y* y() const;
Return a pointer to the current X-axis or Y-axis array, or nullptr if it has not been set.
const int* current = rainfall.y();xSize and ySize
size_t xSize() const;
size_t ySize() const;
Return the number of elements passed to the last setX() or setY() call, or 0 if it has not been set.
setName
bool setName(const char* name);Changes the chart title. Returns false if the new title is identical to the current one; otherwise marks the title as changed and returns true. As with the constructor, the pointer is stored and must remain valid.
Example
#include <Arduino.h>
#include <WiFi.h>
#include <AsyncTCP.h>
#include <ESPAsyncWebServer.h>
#include <ESPDashPro.h>

const char* ssid = "";
const char* password = "";

AsyncWebServer server(80);
ESPDash dashboard(server);

// Chart data must outlive the chart, so it is declared at global scope
const char* XAxis[] = {"Jan", "Feb", "Mar", "Apr"};
int YAxis[] = {10, 25, 40, 60};

dash::AreaChart<const char*, int> rainfall(dashboard, "Cumulative Rainfall");

void setup() {
  Serial.begin(115200);

  WiFi.mode(WIFI_STA);
  WiFi.begin(ssid, password);
  if (WiFi.waitForConnectResult() != WL_CONNECTED) {
    Serial.println("WiFi connection failed");
    return;
  }
  Serial.println(WiFi.localIP());

  rainfall.setX(XAxis, 4);
  rainfall.setY(YAxis, 4);

  server.begin();
}

void loop() {
  static unsigned long lastUpdate = 0;
  if (millis() - lastUpdate >= 5000) {
    lastUpdate = millis();

    // Add new rainfall to the latest month
    YAxis[3] += (int)random(0, 5);

    // Mark the Y-axis as changed, then push the update to all clients
    rainfall.setY(YAxis, 4);
    dashboard.sendUpdates();
  }
}
Notes
- Data lifetime. Charts do not copy axis data.
setX()andsetY()store a pointer to your array, and the array is read each time the chart is serialized for a client. Declare the arrays at global scope or asstatic, never as local variables of the function that callssetX()orsetY(). - Array constness.
setX()andsetY()take a non-const pointer, so the array elements themselves cannot beconst(for example,const int values[]does not compile). An array ofconst char*labels is valid because the elements are pointers. - Matching sizes. Pass the same number of elements to
setX()andsetY()so that each value has a corresponding label. - Layout options. Charts also support
setSize(),setIndex(),setDisplay()and assignment to tabs. To disable chart animations globally, see Toggle Chart Animations.