Pie Chart
Create a pie chart in ESP-DASH v4 and update its X-axis and Y-axis data with updateX() and updateY().
ESP-DASH Pro feature. This functionality is available only in the commercial edition of ESP-DASH.A pie chart shows the proportion of each category in a whole. The X-axis data provides the category labels and the Y-axis data provides the value of each slice.
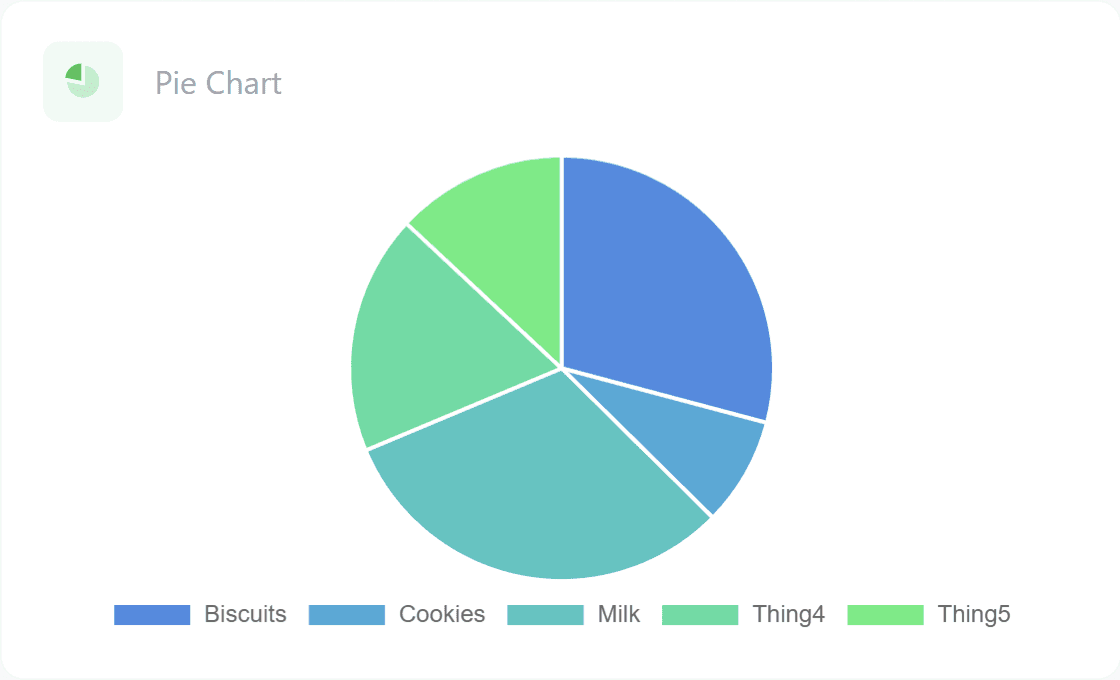
Constructor
Chart chart1(&dashboard, PIE_CHART, "Chart Name");Prop
Type
Methods
Declare the axis arrays in global scope, or otherwise keep them in memory for the lifetime of the chart. The chart references the arrays you pass to updateX() and updateY(); they must not be freed or go out of scope.
updateX()
Sets the X-axis data (labels) of the chart.
String XAxis[] = {"Biscuits", "Cookies", "Milk", "Thing4", "Thing5"};

chart1.updateX(XAxis, 5);
The following overloads are available:
void updateX(int arr_x[], size_t x_size);
void updateX(float arr_x[], size_t x_size);
void updateX(String arr_x[], size_t x_size);
void updateX(const char* arr_x[], size_t x_size);
Prop
Type
updateY()
Sets the Y-axis data (values) of the chart.
int YAxis[] = {0, 0, 0, 0, 0};

chart1.updateY(YAxis, 5);
The following overloads are available:
void updateY(int arr_y[], size_t y_size);
void updateY(float arr_y[], size_t y_size);
Prop
Type
Example
The X-axis labels usually change rarely, so set them once in setup(). Update the Y-axis values whenever new data is available, then call dashboard.sendUpdates().
// ...

AsyncWebServer server(80);
ESPDash dashboard(&server);

/* Axis data in global scope */
String XAxis[] = {"Biscuits", "Cookies", "Milk", "Thing4", "Thing5"};
int YAxis[] = {0, 0, 0, 0, 0};

Chart inventoryChart(&dashboard, PIE_CHART, "Inventory");

void setup() {
  // ...

  /* Set the X-axis once */
  inventoryChart.updateX(XAxis, 5);

  server.begin();
}

void loop() {
  /* Example data */
  for (int i = 0; i < 5; i++) {
    YAxis[i] = (int)random(0, 100);
  }

  inventoryChart.updateY(YAxis, 5);
  dashboard.sendUpdates();

  delay(3000);
}